- Published on
Using amCharts 5 Map with Nextjs for data visualization.
amCharts 5 is a powerful programming library designed for data visualization. It offers various chart types, including maps, and is free to use as long as the amCharts logo is displayed. This blog will guide you through the steps to integrate amCharts 5 Map with a Next.js project, helping you create interactive maps for your next web application.
Create NextJS project
To get started, you'll first need to create a new Next.js project. You can do this by running the following command in your terminal:
npx create-next-app@latest your-project-name
cd your-project-name
Now, you're ready to start working with amCharts.
Install am5charts 5
Next, you'll need to install the necessary amCharts 5 packages. Run the following commands in your terminal:
npm install @amcharts/amcharts5
npm install @amcharts/amcharts5-geodata
npm install @amcharts/amcharts5-fonts
These packages include the core amCharts library, geographical data for maps, and additional fonts to enhance the appearance of your charts.
Imports
Now, let's import the necessary modules into your component. Here's how to do it:
import * as am5 from "@amcharts/amcharts5";
import * as am5map from "@amcharts/amcharts5/map";
import am5geodata_worldLow from "@amcharts/amcharts5-geodata/worldLow";
import am5themes_Animated from "@amcharts/amcharts5/themes/Animated";
import { useEffect } from "react";
These imports bring in the core amCharts functionality, map chart capabilities, geographical data for the world map, and an animated theme to make your map visually appealing.
Basic Component Setup
Let's create a basic component to render the map. This component will include a div element where the map will be displayed:
export default function MapWithClusteredPoints() {
    return (
    <main>
      {/* amCharts5 div */}
      <div
        id="chartdiv"
        className="mt-[28px] md:mt-[110px]"
        style={{ width: "100%", height: "500px" }}
      ></div>
    </main>
  );
}
Adding Map Functionality with useEffect
To bring the map to life, you'll need to add some JavaScript code that initializes the map and handles its behavior. This code should be placed inside the useEffect hook to ensure it runs when the component is mounted:
useEffect(() => {
    /* Chart code */
    // Create root element
    let root = am5.Root.new("chartdiv");

    // Set themes
    root.setThemes([am5themes_Animated.new(root)]);

    // Create the map chart
    let chart = root.container.children.push(
      am5map.MapChart.new(root, {
        panX: "rotateX",
        panY: "translateY",
        projection: am5map.geoMercator(),
      })
    );

    let zoomControl = chart.set(
      "zoomControl",
      am5map.ZoomControl.new(root, {})
    );
    zoomControl.homeButton.set("visible", true);

    // Create main polygon series for countries
    // https://www.amcharts.com/docs/v5/charts/map-chart/map-polygon-series/
    let polygonSeries = chart.series.push(
      am5map.MapPolygonSeries.new(root, {
        geoJSON: am5geodata_worldLow,
        exclude: ["AQ"],
      })
    );

    polygonSeries.mapPolygons.template.setAll({
      fill: am5.color(0xdadada),
    });

    // Create point series for markers
    // https://www.amcharts.com/docs/v5/charts/map-chart/map-point-series/
    let pointSeries = chart.series.push(
      am5map.ClusteredPointSeries.new(root, {})
    );

    // Set clustered bullet
    // https://www.amcharts.com/docs/v5/charts/map-chart/clustered-point-series/#Group_bullet
    pointSeries.set("clusteredBullet", function (root) {
      let container = am5.Container.new(root, {
        cursorOverStyle: "pointer",
      });

      let circle1 = container.children.push(
        am5.Circle.new(root, {
          radius: 8,
          tooltipY: 0,
          fill: am5.color(0xff8c00),
        })
      );

      let circle2 = container.children.push(
        am5.Circle.new(root, {
          radius: 12,
          fillOpacity: 0.3,
          tooltipY: 0,
          fill: am5.color(0xff8c00),
        })
      );

      let circle3 = container.children.push(
        am5.Circle.new(root, {
          radius: 16,
          fillOpacity: 0.3,
          tooltipY: 0,
          fill: am5.color(0xff8c00),
        })
      );

      let label = container.children.push(
        am5.Label.new(root, {
          centerX: am5.p50,
          centerY: am5.p50,
          fill: am5.color(0xffffff),
          populateText: true,
          fontSize: "8",
          text: "{value}",
        })
      );

      container.events.on("click", function (e) {
        pointSeries.zoomToCluster(e.target.dataItem);
      });

      return am5.Bullet.new(root, {
        sprite: container,
      });
    });

    // Create regular bullets
    pointSeries.bullets.push(function () {
      let circle = am5.Circle.new(root, {
        radius: 6,
        tooltipY: 0,
        fill: am5.color(0xff8c00),
        tooltipText: "{title}",
      });

      return am5.Bullet.new(root, {
        sprite: circle,
      });
    });

    // Set data
    var cities = [
      { title: "Malibu, California", latitude: 36.7783, longitude: -119.4179 },
      { title: "Brooklyn, NY", latitude: 40.7128, longitude: -74.006 },
      { title: "Detroit, MI", latitude: 44.3148, longitude: -85.6024 },
      { title: "Tokyo, Japan", latitude: 35.6824, longitude: 139.759 },
      { title: "Istanbul, Turkey", latitude: 41.0082, longitude: 28.9784 },
      { title: "Mumbai, India", latitude: 19.076, longitude: 72.8777 },
      { title: "Shanghai, China", latitude: 31.2304, longitude: 121.4737 },
    ];

    for (var i = 0; i < cities.length; i++) {
      let city = cities[i];
      addCity(city.longitude, city.latitude, city.title);
    }

    function addCity(longitude: number, latitude: number, title: string) {
      pointSeries.data.push({
        geometry: { type: "Point", coordinates: [longitude, latitude] },
        title: title,
      });
    }

    // Make stuff animate on load
    chart.appear(1000, 100);
This block of code sets up the map, adds a zoom control, and creates two series: a polygon series for countries and a point series for markers. It also handles clustering of points and adds interactivity with click events.
Cleaning Up
It's important to clean up the map when the component is unmounted to prevent memory leaks. This is done by returning a cleanup function inside the useEffect hook:
    // cleaning
    return () => {
      root.dispose();
    };
Result
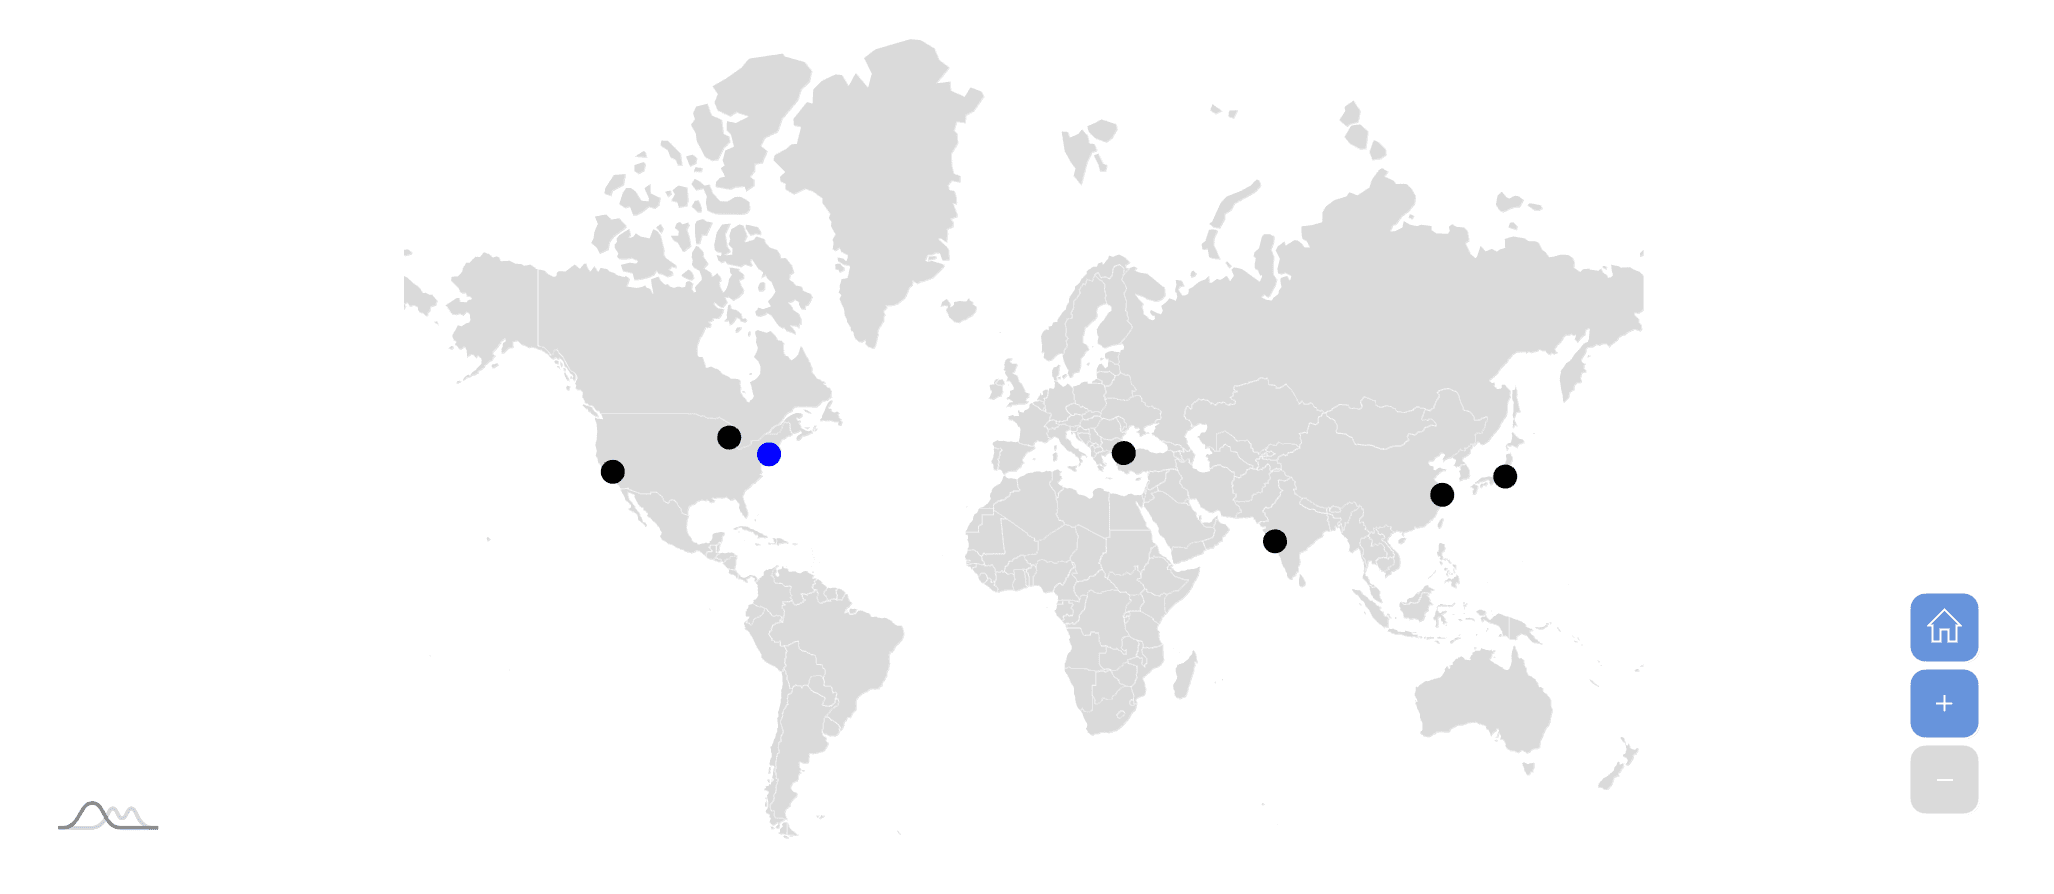
Conclusion
Using amCharts 5 with Next.js is a straightforward process that allows you to create interactive and visually appealing maps. By following the steps outlined in this blog, you can quickly integrate amCharts 5 into your Next.js project and enhance your web applications with dynamic data visualizations.
Feel free to customize the map further to suit your project's specific needs, and explore the amCharts documentation for more advanced features and customization options.